Code Review Dashboard
The Xen project has developed a Code Review Dashboard in collaboration with Bitergia. There are two variants of this dashboard
- xen.biterg.io: User version
- Edit Dashboard and Elastic Search Data: Administrator versions (allows to create extra customizations). If you want specific customisations or access to this panel, please contact
community.manager@xenproject.org.
This document provides a version of the documentation for the user version of the dashboard, that is editable and easily consumable
Contents
- 1 Dashboard Issues: Getting Help
- 2 Basic Concepts
- 3 Git, Overview, Demographics and Data Status Panels
- 4 Code Review Panels
- 4.1 Community Panel
- 4.2 Performance Panel
- 4.3 Backlog Panel
- 4.3.1 Evolution Merged(1) and Non Merged (0) PatchSeries
- 4.3.2 Top People and Domains that got merged
- 4.3.3 Patch Series Merged and Not Merged (Backlog)
- 4.3.4 Use case: Identify recently active patch series
- 4.3.5 Use case: Identify abandoned patch series (those older than 1 year)
- 4.3.6 Use case: Identify patch series in progress
- 4.3.7 Use case: See whether the backlog is increasing
- 4.3.8 Use case: Focus attention on nearly completed reviews
- 4.4 Data-Explorer Panel
- 4.5 Index-Review and Index-Time Panel
- 5 Basic Operations
- 6 Indexes and their Fields (used in Advanced Filters)
- 7 Additional Resources
Dashboard Issues: Getting Help
If you discover a dashboard issue, please contact commuty.manager@xenproject.org
Basic Concepts
Where does the data in the dashboard come from
The following diagram shows how we process the data which serves as basis for the code review dashboard

There are two indexes, whose fields are used in panels, widgets and for searches. The indexes are
xen-patchseries-timefocused: The Performance panel is based on this index. The Index-Time panel exposes the raw data behind this index.xen-patchseries-reviewers: The Backlog, Community and Data-Explorer panels are based on this index. The Index-Review panel exposes the raw data behind this index.
To formulate advanced search queries, refer to the Index Definitions.
Restrictions
| Currently we are only able to map code reviews that are posted on xen-devel@ to the following git repos: xen.git, osstest.git, minios-git and raisin.git. We cannot map Linux, QEMU, FreeBSD, NetBSD, and other code reviews that are cross posted on xen-devel@ to a git repository. Such code reviews will show up in the dashboard: however we are not yet able to determine whether these have completed. In other words, such code reviews will show up us un-merged in the dashboard. |
Predefined Panels
We have pre-defined a number of panels (also called dashboards). These are accessible from the menu bar (see picture below)

You can find a detailed description of individual panels here.
Widgets
Widgets show the basic unit of visualising data in dashboards. The picture below shows two example widgets (a time based diagram and a table).
 Notes:
- Double clicking on elements in widgets can be used to create a simple filter
- A select operation can be used in time based diagrams to select an absolute time filter
- Note that you can resize and re-arrange widgets, should you wish to
Mapping reviews to e-mails
Both indexes and thus many widgets contain a message_id fields, which
- can be used to retrieve the message in an index in your inbox (please refer to your mail client’s documentation)
- can be used to find a message via marc.info. Note that in most series, patch, comment, etc. related tables, there are direct clickable links to marc.info e-mails

Following the marc.info link will get you to the respective patch series, patch, comment, etc.
We use the following syntax is to map the message_id field to e-mails:
http://marc.info/?i=<message_id>
If the message_id=<1455681279-28451-1-git-send-email-jfehlig@suse.com>, then the relevant search query is
http://marc.info/?i=<1455681279-28451-1-git-send-email-jfehlig@suse.com>
Tables
Data in tables can be exported as a comma-separated-values (CSV) file. To do this, click on either the Raw or Formatted links at the bottom of any of the detailed information tabs. A raw export contains the data as it is stored in Elasticsearch which is used to store the two data indexes on which all visualisations are based. A formatted export contains the results of any applicable Kibana field formatters: for example a formatted export, will save message_id fields as URLs rather than the actual IDs, dates as timestamps, etc.
Percentiles
Several charts (like the one in the screenshot below), show data which are divided into 3 percentiles. The datasets are ordered by a specific metric, and are grouped up to the 25%, the 50%, the 75% percentile and in some cases the 95% percentile.

This approach is easiest to explain by example: In this case, we are measuring time2merge (= the time it takes to merge a patch). The data is arranged n a sorted histogram, with the number of patches in a series (aka NumPatches) arranged in buckets of decreasing population on the x axis. In this example, looking at the x-asis entries of NumPatches=5, the
- 25th percentile means that 25% of all series which consist of 5 patches are merged in 0.753 days
- 50th percentile means that another 25% (from 25th to 50th) of all series which consist of 5 patches are merged in 3.479 days
- 75th percentile means that another 25% (from 50th to 75th) of all series which consist of 5 patches are merged in 15.829 days
Note that in the image above for NumPatches=22, 24 and 27 the there is only 1 patch and thus the 3 percentiles are the same.
The exact data can be obtained by hovering over elements in this widget.
Filters
Data in each panel can be filtered in a number of different ways. The picture below shows the three different filters

- Time Filter: Allows to select a time period
- Advanced Filters: Allows to create complex filters (requires knowledge
- Filters: Allows to filter through data that is displayed in widgets. Typically you create simple filters (e.g. filter reviews submitted by an individual) by selecting an item in a widget.
For more information on filtering see Filtering.
Sharing views with Filters
You can share dashboards with filters by selecting the Share Icon, which is marked on the right in blue in the screenshot below.

Git, Overview, Demographics and Data Status Panels
Git, Overview, Demographics
The following panels show various aspects of git commits per sub-project. These are fairly self explanatory, although I will add some more information on how to use Demographics later.
You may want to read Basic Operations for filtering by time and specific sets of data. There are also a number of Advanced Filters which are useful for these panels:
Below are a few useful example queries
project: "Xen Hypervisor" OR "Windows PV Drivers"
lists commits from these two projects
repo_name: "git://xenbits.xen.org/xen.git" OR "git://xenbits.xen.org/osstest.git"
lists commits from these repositories (note: check the correct repository names in the Repositories widget in the Git panel
Data Status
This panel shows the last time git repositories were processed
Code Review Panels
The Xen Project Code Review dashboard has 4 panels: One for documentation, a Community Panel, a Performance Panel and a Backlog Panel.
Community Panel
In this panel, several widgets are grouped by use-case.
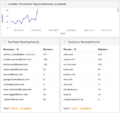
Top Reviewers
Imbalances between Reviewers and Contributors
Post ACK Comments
Flag analysis
Drill into Review activity information


Use case: Identify top reviewers (for both individuals and companies)
Evolution 'Reviewed-by' flag (no patchseries, no patches)
Shows the evolution of the Reviewed-by flag over time. Allows to create a time filter.
Top People and Domain Reviewing Patches
Counts the number of people and organisations who commented on other people’s patches (by counting the Reviewed-by attributes) in the selected time period. Allows to filter by developer (e-mail address and e-mail domain).
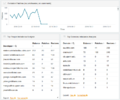
Use case: Identify Imbalances between reviewers and contributors
Evolution Patches (no patchseries, no comments)
Shows the evolution of the patches posted over time. Allows to create a time filter.
Top People and Domain Imbalance Analysis
Over the selected time period, the following fields are aggregated per person or domain
- Balance: Difference between patches posted and and comment activity. A positive number implies that the person or organisation comments more than she posts patches.
- Patches: Number of patches posted
- Reviews: Number of
Reviewed Byflags
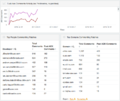
Use case: Identify post-ack comments on patches
Evolution Comments Activity (no patchseries, no patches)
Shows the evolution of comments made on patches (both real and self-comments) over time. Allows to create a time filter.
Top People and Domain Commenting on Patches
Over the selected time period, the following fields are aggregated per person or domain
- Comments: The number of review comments on other people’s patches.
- Post ACK comments: The number of comments made after a patch has been ACK’ed
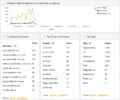
Use case: Flag analysis
Evolution Flags (no patchseries, no comments, no patches)
Shows the evolution of flags made on a patch series. Allows to create a time filter.
Top People and Domain Ack Analysis
Over the selected time period, ACKs are aggregated per person or domain.
Top Flags Analysis
Over the selected time period, git tags (a good definition of their use can be found here are aggregated.
Use case: Drill into Review activity information
The following widgets are of particular interest to code submitters, reviewers and maintainers. A similar view, which is optimised to identifying which code reviews are almost complete are visible in the Backlog and Data-Explorer panels.
Evolution Email Activity (patchseries, patches, comments)
Shows the evolution of review related e-mail activity over time. Allows to create a time filter.
Evolution Patch Series (no patches, no comments)
Shows the evolution of patch series posted over time. Allows to create a time filter.
Patch Series
Lists the patch series in an exportable table that satisfy selected filters.
Reviews (using Reviewed-by flag)
Lists emails that set the Reviewed-by flag that satisfy selected filters.
Comments
Lists emails comments that satisfy selected filters.
Performance Panel
The data presented in this panel allows us investigate merge time, complexity of patches, number of review comments and other related metrics which indicate complexity and correlate the different properties.
Important notes:
|
Each section below, gives a brief overview of the widgets that are present in this panel.

PatchSeries
Counts the number of patch series
PatchSeries per Year
The pie chart represents the total number of patch series that were merged per year. When clicking on some of the portions of the pie, this will create a time based filter for that specific year.
Evolution NumPatches per PatchSeries
Total number of patches for selected patch series over time, arranged in percentiles. An indirect measure for complexity of patch series submitted over time.
Ability to create a time based filter.
Time to merge per number of patches per patch series
A histogram that shows the time to merge on the y axis and the number of patches per series on the x-axis. The histogram is sorted in order of descending population (like a Pareto chart), with values that occur most often on the left and values that occur least often on the right.
Creates a filter for the num_patches = <selected column on y axis>
Evolution NumVersions per PatchSeries
Total number of re-posted versions for selected patch series over time, arranged in percentiles. An indirect measure for the degree of actionable feedback and possible quality/complexity issues on the patch series submitted over time.
Ability to create a time based filter.
Time to merge per versions of patches per patch series
A histogram that shows the time to merge on the y axis and the number of reposts per series on the x-axis. The histogram is sorted in order of descending population (like a Pareto chart), with values that occur most often on the left and values that occur least often on the right.
Creates a filter for the num_versions = <selected column on y axis>
Evolution NumVersions per PatchSeries
Total number of re-posted versions for selected patch series over time, arranged in percentiles. An indirect measure for the degree of actionable feedback and poss
Backlog Panel

Evolution Merged(1) and Non Merged (0) PatchSeries
Shows the evolution over time of merged and un-merged patch series. Note that we cannot currently identify patch series to other projects (e.g. Linux, QEMU, …) that are cross-posted on xen-devel@ as merged, even if they have in fact been merged.
Top People and Domains that got merged
Lists the number of people and organisations that were merged.
Patch Series Merged and Not Merged (Backlog)
Lists the patch series that were merged and not merged
Use case: Identify recently active patch series
Use one of the following pre-defined time filters to identify review activity in a certain time period (as defined below):
Hot      = [now to 1st week}
Warm     = [1st week to 1st month}
Tepid    = [1st month to 2nd month}
Cold     = [2nd month to 5th month}
Freezing = [5th month to 1 year}
Dead     = [1 year to *}
Check the Patch Not Merged (Backlog) widget to identify series that were not merged.
Use case: Identify abandoned patch series (those older than 1 year)
Use the Dead time filter and check the Patch Not Merged (Backlog) widget to identify series that were not merged.
Use case: Identify patch series in progress
Check the Patch Not Merged (Backlog) widget or merged:0 filter to identify series that were not merged.
Use case: See whether the backlog is increasing
Use the Evolution Merged(1) and Non Merged (0) PatchSeries widget together with the merged:0 and merged:1 filter to identify trends
Use case: Focus attention on nearly completed reviews
Use the following filters to identify patches that are nearly complete. Note that these filters can also be used in the Data-Explorer Panel:
patchserie_percentage_ackedpatches(number): contains the % of acked patches in a specific patch series. Numbers may range from0to100. Use the[90 TO 100}notation for filters.patchserie_numackedpatches(number): contains the number of acked patches for a particular patch seriespatchserie_numpatches(number): contains the number of patches that make up a particular patch series
Data-Explorer Panel
This view is intended to allow you to explore all components of a specific patch series. This view is tailored towards code submitters, reviewers, maintainers, committers and release managers. Documentation is available in the panel itself. It can also be used as a more detailed view into review related messages using the techniques outlined in the Backlog panel.

Basic Use
In it's basic use, it is intended to be filtered by
patchserie_id: <target series>, which can be refined bypatch_id: <target patch>. Note that when you select apatch_id, no results will be showed for the series as patch series do not have a validpatch_idfield
You will then see all comments, flags and other attributes that are applicable to the selected series or patch. An example which shows
- A sufficiently complex patch series, which shows how this panel works is
patchserie_id: 8448 - A simpler one is
patchserie_id: 9549
You will also be able to check the % of patches that are Acked in the Acked-by table and where the ACK's were awarded. You can go to the actual message by following the marc.info link.
Note that this table is big and will take some time to load. You may want to restrict the time-frame.
Getting a patchserie_id and patch_id
You may want to explore code reviews by any of the other attributes in the xen-patchseries-reviewers index. In particular, the following fields are useful
patchserie_percentage_ackedpatches, if you are looking for nearly completemerged, if you want to look for patches that have been merged or not mergedsender, if you are looking for a patch from a specific personsubject, if you are looking for a patch or series and you know the title or parts of it. It is particularly useful when used in combination with fuzzy search expressions.message_id, if you are looking for a specific review and you know the message ID (e.g. because it is in your inbox)
For further fields see xen-patchseries-reviewers index and filtering.
Index-Review and Index-Time Panel
This view provides raw access to the raw xen-patchseries-reviewers and xen-patchseries-timefocused indexes and can be used to explore the raw data behind other panels.
Basic Operations
Filtering
Data in each panel can be filtered in a number of different ways. The picture below shows the three different filters
- Time Filter: Allows to select a time period
- Filters: Allows to filter through data that is displayed in widgets. Typically you create simple filters (e.g. filter reviews submitted by an individual) by selecting an item in a widget.
- Advanced Filters: Allows to create complex filters (requires knowledge
Setting the Time Filter
The Time Filter restricts the search results and all widgets within a panel to a specific time period. By default the time filter is set to the last 5 years. You can use the Time Picker in the upper right corner of the menu bar to open the Time Picker. Click the caret at the bottom of the Time Picker to hide it.
Quick Filter: To set a quick filter, simply click one of the shortcut links. The quick filter contains a number of pre-defined time periods. We added a number of Xen Project specific quick filters:
Years, to make selection of activity in a specific year easier- A set of time periods (
Hot,Warm,Tepid,Cold,FreezingandDead) which are relevant to identify review activity in a certain time period (as defined below):
Hot      = [now to 1st week}
Warm     = [1st week to 1st month}
Tepid    = [1st month to 2nd month}
Cold     = [2nd month to 5th month}
Freezing = [5th month to 1 year}
Dead     = [1 year to *}
- A set of time periods, which match Xen Project release cycles.
Xen 4.7 cycle = [timestamp of tag RELEASE-4.6.0 TO *] (we will need to change * in future and add new ones as new tags are created)
Xen 4.6 cycle = [timestamp of tag RELEASE-4.5.0 TO timestamp of tag RELEASE-4.6.0}
Xen 4.5 cycle = [timestamp of tag RELEASE-4.4.0 TO timestamp of tag RELEASE-4.5.0}
Xen 4.4 cycle = [timestamp of tag RELEASE-4.3.0 TO timestamp of tag RELEASE-4.4.0}
Xen 4.3 cycle = [timestamp of tag RELEASE-4.2.0 TO timestamp of tag RELEASE-4.3.0}
Xen 4.2 cycle = [timestamp of tag RELEASE-4.1.0 TO timestamp of tag RELEASE-4.2.0}
Relative Filter: To specify a relative Time Filter, click Relative and enter the relative start time. You can specify the relative start time as any number of seconds, minutes, hours, days, months, or years ago.
Absolute Filter: To specify an absolute Time Filter, click Absolute and enter the start date in the From field and the end date in the To field.
You can also set an absolute time filter by selecting a time interval in any widget that has time in the x axis (they typically are named Evolution of XYZ) . Click and drag to select a specific timespan. You must start the selection with the cursor over the background of the chart: the cursor changes to a plus sign when you hover over a valid start point. You can use the browser Back button to undo your changes.
Working with Filters
Widgets
Some widgets (check the widget descriptions in panels) allow you to create a filter. When you create a filter anywhere in Kibana, the filter is displayed in a green oval under the search text entry box. Hovering on the filter oval displays icons to enable, pin, toggle, remove and customise the filter. For more information see Discover Filters.
Search Widgets
In search widgets (their name always starts with Search and they are only exposed in the Index-Review and Index-Time panels), you can use any field in any data record (also called document) to create a filter. For more information, see Filtering by Field.
Advanced Filters
Search field and query syntax
The search field underneath the menu bar provides a way to query a specific subset of transactions from the selected time frame and set filters. The query syntax is based on the Lucene query syntax. Also see Kibana Queries and Filters for additional background info.
Important notes:
- To reset a search, add
*into the search field. - Sometimes, complex search queries fail, unless the search field has been reset
- The type of field (
string,analysed string,number,date, etc.) has an impact on the query syntax - Queries are case sensitive
- To construct sensible queries, please check the information here. You can only create queries that use fields within the respective index that is used in a panel: if you use a field that does not exist, the search will return No results found.
- Fields that are not available in an index are defaulted to
-1fornumbersandnaforstrings - Use time filters for time based searches as the Lucene query syntax does not seem to be correct for time based fields
- Text wildcards searches do only work for the following fields (fields need to be of type
analysed stringfor wildcards to work):message_idandsubject
Advanced Filter Examples
Below are a few examples of queries
subject: *x86*
patches with x86 in the subject line
patchserie_id: [6000 TO 6100]
lists patch series with IDs between 6000 and 6100
num_patches: 1
lists patch series that only have one patch in the xen-patchseries-timefocused index (the corresponding field in the xen-patchseries-reviewers index is patchserie_numpatches)
subject: *x86* AND patchserie_numpatches: [10 TO *]
lists patch series with x86 in the title and contain more than 9 patches (index is xen-patchseries-reviewers, which applies to the Backlog, Community and Data-Explorer panels)
subject: *arm* AND patchserie_numpatches: [5 TO *] AND merged: 1
lists merged patch series with arm in the title and contain more than 5 patches
patchserie_id: [6000 TO 6100] AND num_patches: 1
lists patch series with IDs between 6000 and 6100 which consist of exactly 1 patch in the series
patchserie_id: [6000 TO 6100] AND num_patches: {2 TO *]
lists patch series with IDs between 6000 and 6100 which consist of more than 1 patch in the series
patchserie_percentage_ackedpatches: [50 TO 100]
lists patch series whose patches are between 50 and 100 % acked
patchserie_numackedpatches: {1 TO *] AND patchserie_numpatches: [3 TO *]
lists patch series with more than 1 acked patch which consist of 3 or more patches
patchserie_numackedpatches: [7 TO *] AND patchserie_numpatches: [10 TO *]
lists patch series with more than 6 acked patch which consist of 10 or more patches
patchserie_numackedpatches: [7 TO *] AND patchserie_numpatches: [10 TO *]
lists patch series with more than 6 acked patch which consist of 10 or more patches
sender:"andrew.cooper3@citrix.com" AND merged: 0
lists patch posted by andrew.cooper3@citrix.com which were not merged. Note that text wildcards do only work on the subject and message_id fields
time2commit: [100 TO *]
lists patch series that took more than 100 days to merge (only works in xen-patchseries-timefocused index and Performance view)
Working across indexes
Note that some fields are only available in the xen-patchseries-timefocused index and thus the Performance panel. However, the patchserie_id field is in both indexes. This means you can use
time2commit: [100 TO *]to for example identify an interesting series that took 100 days or more to merge- Write down the
patchserie_id(e.g. 3170 which describes a series called Xenstore stub domain) - Use
patchserie_id: 3170for example in the Data Explorer dashboard to drill into this series
Indexes and their Fields (used in Advanced Filters)
Indexes used for each panel
There are two indexes, whose fields can be used in advanced filter queries. The indexes are
xen-patchseries-timefocused: The Performance panel is based on this index. The Index-Time panel exposes the raw data behind this index.xen-patchseries-reviewers: The Backlog, Community and Data-Explorer panels are based on this index. The Index-Review panel exposes the raw data behind this index.
Index: xen-patchseries-timefocused
The basic piece of information in this index is the patch series. Each row or entry represents an unique patch series that is defined by the patchserie_id field. Each of the columns (or fields) provide extra insights about that specific patch series. For example, it provides the number of patches, number of comments or the time when that patch series as a whole was committed.
This index consists of the following fields:
message_id(analysed string): message id as this is retrieved from the mboxnum_comments(number): total number of comments for that patch series. A comment is defined as an email replying a patch in a patch series thread.num_patches(number): total number of patches for that patch series.num_versions(number): total number of versions for that patch series.sender(string): email of the developer that send the patch seriessubject(analysed string): original subject of the patch series. The[Patch]tag has been removed. Ifnum_patches > 1, then the subject line of the cover letter[Patch 0/x]is used.time2commit(number): total time measured in days since the last comment on a patch serie took place till this is merged into the base code.time2merge(number): total time measured in days since a patch serie is sent till this is ‘acked-by’ a developer.committime(date): date when the patch serie was committed in the Git repository.lastcommentdate(date): last date when a patch serie receives a commentmergetime(date): date when the patch series is merged (acked-by)num_commenters: total number of different people replying to a patch seriespatchserie_id(string): an unique id (integer) is provided to each of the patch seriessender_domain(string): domain of the developer sending the patch series to the mailing listsent_date_x(date): date when the patch series was originally sent
Index: xen-patchseries-reviewers
This index contains more detailed information about the code review process: in addition to patch series, this provides information about patches, comments, self comments, flags and other events that take place during the code review process.
The following columns make up this index: the emailtype column determines, which further columns are valid.
emailtype(string): depending on the type of email, this field has one of the following values. There are 5 of them:flagthat identifies when a developer uses any of the special tags that help to understand the code review process such asCc,Reviewed-by, orAcked-byamong others.commentidentifies comments made by anyone who didn’t post the patch.self-commentidentifies comments made by the person who did also post the patch.patchis the basic part of a patch serie. This is an email that contains a piece of source code to be reviewed by others.patchserieis the identifier used when referring to the aggregation of all of the patches. There are patch series of one or more patches.
The following columns are common to the entire table, regardless of the value of emailtype.
sender(string): developer that sent thepatchserie,patch,commentorself-comment. In the case of being a ‘flag’, then this is the value in that flag (and not the developer sending the email as an email may have several flags such as ‘signed-off’ or ‘cc’.sender_domain(string): domain of the sender of that email. In the case of a ‘flag’, this is the domain of the developer specified in the flag.sent_date(date): this is the date when an event was sent.subject(analysed string): original subject of the comment, flag, patch or patch series. If a patch series the[Patch]tag is removed: ifnum_patches > 1, then the subject line of the cover letter[Patch 0/x]is used.patchserie_id(number): unique ID that is set for all flags, comments and patches that relate to a specific patch series.patch_id(number): unique ID that is set for all flags, comments and patches that relate to a specific patch. Set to-1for a patch series.message_id(analysed string): message id as retrieved from the mbox
And then each of the values of ‘emailtype’ has specific related columns:
Applicable to emailtype = patchserie
patchserie_numackedpatches(number): contains the number of acked patches for a particular patch seriespatchserie_numpatches(number): contains the number of patches that make up a particular patch seriespatchserie_percentage_ackedpatches(number): contains the % of acked patches in a specific patch series. Numbers may range from0to100.merged(number):1if this was detected as merged into the git repository.0if this is not detected as being merged into Git.
Applicable to emailtype = patch
patch_id(string): unique identifier of the patch. It is equivalent to themessage_idthat is retrieved from the mbox.merged(number): this contains a1if the patch was merged.0if the patch is not merged.is_acked(number): this value contains a1if this patch wasackedby any developer. In other cases this value is0.
The following fields are not really useful for searching: num_patch and number
Applicable to emailtype = flag
num_flag_review(number): this value is1if the flag used isReviewed-by.0in other cases.num_flag_ack(number): this value is1if the flag used isAcked-by.0in other cases.
The following fields are not really useful for searching: balance and number
Applicable to emailtype = comment and emailtype = self-comment
comment_id(string): this provides an unique identifier for each of the comments. These are the emails replying to a patch.post_ack_comment(number):1identifies any comment that occurs place after anAcked-byflag is found in a review.0in other cases.
The following fields are not really useful for searching: balance and number
Additional Resources
The following articles provide useful background reading on using Kibana based panels:
- Dashboard describes all functionality that is available in Dashboards or Panels. Note that any functionality that allows changing and saving dashboards is disabled in xen.biterg.io. If you want specific customisations, please contact
community.manager@xenproject.org.